
This year we had the honor to host the 10th anniversary edition of the DHBenelux conference at the Royal Library of Belgium (KBR). In this blog post I will reflect on the different sessions I’ve attended at this year’s multitrack edition of DHBenelux 2023. I will group my notes around the following four recurring topics of the talks that I have seen: (1) data platforms and their usability, (2) how digital methods such as Linked Open Data are used for DH research, the other way around, (3) how DH research studies digital methods and tools, and finally (4) research with (historical) geospatial data in cultural heritage.
Context
Digital Humanities (DH) is a discipline in which computational methods are combined with humanities research, both by systematically using digital methods and artifacts for humanities research and by studying the application of said methods.
To foster DH research in Belgium, the Netherlands and Luxembourg (Benelux), the DHBenelux conference was founded in 2014. Although the focus lies on these three countries, the conference is open to anyone interested and the conference language is English.
This year’s edition had several tracks and because I have a technical background and mainly work with data and research data infrastructure, I mainly followed more technical sessions. However, if you are interested in other talks, the abstracts of the conference are openly available in the DHBenelux 2023 community on the research repository Zenodo (persistent), or on the DHBenelux 2023 website.
My main takeaways are
- Digital methods support the humanities research, but humanities methodologies can also positively influence digital tools and methods
- the use cases of the diverse humanities research provide excellent food for thought for data management practices, for example what kind of biases exist and what good practices are
- the conference aims at community-building and experience exchange which I find is the greatest distinction to the more competitive Computer Science conferences I’ve attended in the past (which have a much lower acceptance rate of for example 25% compared to the 90% of DHBenelux)
Because the conference took place at my workplace, I did not travel to the conference. This also meant that I commuted home and did not join most of the social programme (#partypooper). Therefore, and also because I volunteered during the conference for the organizers that are my colleagues, I will focus in this blog post mainly on the scientific presentations and discussions and less on the venue.
Instead of listing the talks chronologically, I will group my notes under the following recurring topics I have encountered in the talks that I have attended.
- Data platforms and usability
- Using humanities methodologies for digital resources
- Using digital methods for humanities research
- Geospatial research
There were also a few workshop the day before the conference, but I did not participate in any of the workshops as non of the workshops sparked my immediate interest and I anyway had some work to finish 🙂 This was only my second DHBenelux conference, but it seems that a combination of workshops about DH tools and Linked Open Data are common. This is great!
Inhaltsverzeichnis
Data platforms and usability
Humanities research revolves around a lot of valuable and super interesting data such as Libraries’ collections, digitized documents, or other media data. Different platforms and tools exist to work with this data in a user-friendly way. I would say even more than in Computer Science, user-friendly interfaces are a must for less-technical users in the Humanities. Therefore it is nice to see different efforts around usability.
There have been talks about usability of the CLARIAH Media Suite in the Netherlands, the upcoming DATA-KBR platform in Belgium, as well as the LuxTIME and the Tropy projects in Luxembourg. On top of that, other talks focused on data visualization.
Stakeholder Readiness Level in the CLARIAH Media Suite
Roeland Ordelman presented User-related research around the CLARIAH Media Suite. What I really liked is the idea to build something similar to the Technology Readiness Level (TRL) but for usability by different stakeholders: the so-called Stakeholder Readiness Level (SRL). I find this a very interesting and holistic approach that, on the one hand, can improve the usability of systems, and on the other hand could be used as a benchmark to compare the usability of systems.
My own research on usability has been a while, but I can clearly see how it could be connected or extended. For example, how a Stakeholder Readiness Level could be used to measure the customer journey when using public services (DOI: 10.5281/zenodo.8001638, FAST project) or to define requirements for a user interface that uses visual notations to visualize constraints of data constraint languages (DOI: 10.3233/SW-210450).
Difference between scholar and journalist users
Besides the presentation of Roeland about the general Stakeholder Readiness Level, Willemien Sanders talked about differences between scholars and journalists when creating data stories with the media suite.
There are differences with respect to speed, transparency, reflection, data/service provider involvement and sensitivity/copyright issues. More details about the differences are in the abstract. In my opinion this kind of research is very important. Not only to understand the user needs better, but also to improve the digital product and to come up with suitable tools and business models.
Lessons learned when building a consortium of stakeholders - LuxTIME project
Petros Apostolopoulos and Sean Takats shared their experiences from the creation of a consortium to analyze and interpret historical big data within the Luxembourg Time machine (LuxTIME) project DOI: 10.5281/zenodo.7986361.
They performed interviews that focused on the following four aspects: historical data, research initiatives, collaborations with other institutions, and future collaboration with the project and participation in the consortium.
These interviews were necessary, because detailed information about what historical data is held at the institutions or in which research initiatives the institutions are involved is often not available on their websites. The objective is to map the state of the art of historical data in Luxembourg.
Interestingly, some institutions do not consider their existing digitization initiatives as research projects, because, according to these institutions, these initiatives do not involve research.
One objective is not to complicate collaboration even further by needing to select representatives, but rather create a peer-to-peer collaboration. Additionally, regular meetings should be organized alternately at the different consortium members locations to strengthen the collaboration.
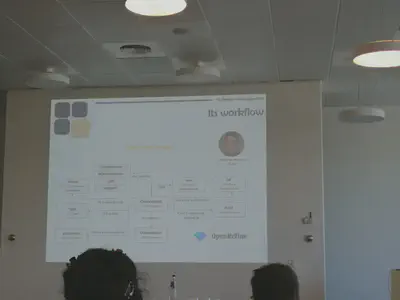
Turn photos into items
Anita Lucchesi and Sean Takats presented the Tropy platform. It helps in organizing research collections: imagine that you have a bunch of images in a folder, with Tropy you can annotate and organize the images. Among others, this allows at a later stage to export the items in standardized data formats.
Collection-centric approach
Sally Chambers presented updates on the DATA-KBR project that aims to optimize KBRs ICT infrastructure to stimulate sustainable data access. This contribution is therefore not only about an upcoming platform (for now internally a Nextcloud instance is used), but also about the collections themselves: collections as data.
The updates she presented focus on a researcher-centered and iterative approach to gather requirements. If you are interested to read more about how to publish collections as data, she referred to the pre-print A Checklist to Publish Collections as Data in GLAM Institutions DOI: 10.48550/arXiv.2304.02603
Focussing on collections and data instead of being too application-centric made me think of the amazing book Software Wasteland from Dave McComb. After all we want to study cultural heritage collections!
I got a similar vibe from a question that was asked during the talk of Loren Verreyen about her previous work on Radio’s ephemerality in DH. There she used textual data from the BBC programme index to study BBC producers of the Third Programme (1946 - 1967). Digitized documents from a broadcast listing magazine were used as a basis.
A question from the audience, whether corrected OCR data of the research project was fed back to the BBC portal, got my attention. According to Loren, this has not yet happened but would be very useful. I like this idea of a more collection-centric approach where different smaller or larger research projects continuously improve or extend a collection.
This made me also think of the Researcher-in-residence programme of the Royal Library of The Netherlands. In this programme, researchers have to use existing digital collections to perform research and improve or extend these collections (or create new collections/datasets). Like this, the collections get richer over time. By the way, as of writing this post, they are looking for a new researcher-in-residence, check out their website!
Another very interesting talk from Douwe Zeldenrust about the Records Continuum Model highlighted the evolution of collections.
In his talk, he presented meta research about the Dutch language in the United States that originally was performed by Jo Daan. More precisely, Douwe focused on the archiving process of research data. He did so based on the example of Jo Daan’s collection and several other collections that were added later during other PhD projects which partially built their collection on top of the one from Jo or criticized the original collection.
Visualizations and user interactions
When talking about users and usability, visualizations are always important!
Aida Horaniet Ibañez investigated the current situation of data visualization in DH (DOI: 10.5281/zenodo.7963466). She collected a corpus of more than 200 figures from research papers. After noticing that there was a predominance of statistical graphs, they extended the corpus with 500 extra figures from online magazines, social media, etc.
Basically the presented research differentiates between the following three types of visualizations:
- Statistical graphics (reducing cognitive load by visualizing reliable data sources)
- Data humanism (in-depth details about context where design and topic stimulates the user’s interest)
- Humanistic interpretation (visualizations with user interaction)
Apparently, only a few tools support the latter two of the types. One interesting finding was that many visualizations from personal blogs are unavailable after a while. In my opinion, yet another good reason for heritage institutions to invest in web and social media harvesting (like we did at KBR with the BESOCIAL project, or like the International Internet Preservation Consortium (IIPC) does on a large scale).
Using humanities methodologies for digital resources
One fascinating thing about DH is that digital methods are not only used within DH, but humanities methodologies are also used to study digital resources. I think this provides new and interesting ways to look at the technology we are building and using!
There have been presentations about post colonial heritage, Wikidata’s data model and inclusivity, and best practices when annotating human characters in children’s literature according to ethnicity and gender.
Keynote about Cosmovision
This keynote from Patricia Murrieta-Flores focused on decolonial praxis in the Digital Humanities. She talked about languages in the Mesoamerican area. Apparently, there existed more than 68 languages before the “Conquest of America”! Yet most we know was written by Europeans.
My main takeaway is the following paraphrased quote:
“Be aware of the role of our work as DH researchers, there are also other perspectives in the world that are equally wonderful and which should be taken into account.” - Patricia Murrieta-Flores (paraphrased)
Most of the existing texts in her field are written from one perspective only: written by the colonizers and not the indigenous people. Partricia made the following comparison: Imagine all books about France and its culture would have been written by the British and in English. This would probably give a different view on things.
According to Patricia, this is also a crucial aspect for machine learning: there is a lack of training material for certain topics and definitely from different worldviews, which raises the question if AI is safe to use!
And if you wonder what Cosmovision is (I have to admit I did not know it): According to Law Insider,
“Cosmovision means the conception that indigenous peoples have, both collectively and individually, of the physical and spiritual world and the environment in which they conduct their lives.” - Law Insider
So in simple terms, it is about different worldviews.
The expressiveness of Wikidata
Ammandeep K Mahal and James Baker presented their work on histories of women active in archaeology, history and heritage in the BeyondNotability project. They curated and publish a dataset in a Wikibase instance.
Their presentation focuses on the free and open knowledge base Wikidata. Mainly they criticize the following three points (summarized in my understanding):
- Wikidata statements do not accommodate for complex historical phenomena, such as (historical) women life’s combining paid work and care work
- Ethnicity and citizenship are likewise not represented in a sufficient detail, even worse, bots often assume citizenship based on other properties and change the values
- Sex and gender in Wikidata are sexOrGender, (a single property)
My opinion: Without considering any context about the meaning of the property itself, I have to say that the third point seems already questionable: a property with the word “or” in the name should, according to me, be split into several properties!
A key message of their talk was that Wikidata has a clean and simple interface which suggests simple and authoritative facts. However, the talk pages behind the interface may provide more controversial discussions that the average user might not be aware of.
I think: Data models can be made as complex as necessary. In the vision of the Semantic Web and Linked Open Data, anyone can create their own ontology to accommodate any world view in detail. The practice, however, has taught us that a few broad and simplified solutions often get the most attention. For data models, for example the generic schema.org vocabulary and for data, apparently, the Wikidata platform that does not even have a formal ontology.
This simplicity makes such solutions appealing but indeed amplifies certain world views and leaves out important context. I think that setting up a domain-specific Wikibase with its own vocabulary, as the authors did, is for now the best solution. A solution that resonates the most with the original Semantic Web vision of many decentralized ontologies (even though in this case it is not a formal ontology).
Uncertainty when labeling images
The talk of Paavo van der Eecken about the use of digital tools for uncertain humanities data was very interesting. In a nutshell, the talk covered considerations when creating labels used to annotate and categorize human characters on images in children’s books. I have learned that it is very important to use labels that are as specific as possible when dealing with ethnicity and gender to avoid biased generalizations.
But I also learned that, when labeling images, there is a difference between ontological doubt and epistemic doubt. The former refers to unclear boundaries and the latter to incomplete knowledge. Knowing these theoretical foundations helps, on a very practical level, to plan, schedule and execute projects with human annotators and to achieve the best possible outcome.
Using digital methods for humanities research
Many talks actually covered this kind of topics as it is a core part of DH research. However, since it was a multi track conference, I only attended a few talks that applied digital methods for humanities research.
I have attended talks that apply Linked Data for Greek mythology narratives or the Dutch East India Company, and persistent identifiers for library catalogs.
Linked Open Data for Greek mythology
Daria Kondakova and Jakob Kohler talked about their use of Linked Open Data to study methodological narratives.
They have built a tool with a user interface to create narratives in the form of RDF triples, with the aim to compare mythological narratives. Currently they are investigating how they can express relationships between the narratives. For example, Zeus in story A is not the same as Zeus in story B.
Thinking about it, one part of the solution could be to use the W3C PROV ontology and specify that the different Zeus instances are a specialization of a more broad Zeus concept (PROV agents can also be PROV entities I believe). Yet this would not solve the initial issue as there are still no relationships between the Zeus specializations.
Maybe named-graphs might be a solution to encapsulate the different narratives. In such a scenario there should be only one Zeus URI, but it would be used in different named-graphs. One would not have to explicitly specify the relations between different Zeus URIs, each is embedded in the context of the narrative named-graph.
Linked Data thesauri to study the Dutch East India Company
Brecht Nijman and Kay Pepping presented their work in building a SKOS taxonomy DOI: 10.5281/zenodo.7973694.
They want to unlock a key resource of the Dutch East India Company archive: the Overgekomen Brieven en Papieren which are roughly 5mio digitized documents. These handwritten documents went through a Handwritten Text Recognition (HTR) step.
However, due to text recognition errors or different spellings as well as synonyms, a simple text search for a concept is not sufficient. Their example was the herb Clove (Dutch: kruidnagel) that could be written as kruidnagel, kruytnagel, garioffelnagel, moernagel, etc.
Because existing thesauri are not detailed enough they created their own SKOS and SKOS-XL taxonomy with the tool PoolParty.
Persistent ISNI identifiers for research and legal deposit
My colleague Ann Van Camp and our volunteer Sergio Alonso Mislata presented the benefits of using a persistent ISNI identifier for contributors to creative works in the catalog of the Royal Library of Belgium.
This helps not only in the research projects BELTRANS and CAMille, but also to identify relevant works for the legal deposit in Belgium.
A side note: Sergio addressed us after a conference last year, saying that he would like to know more about Linked Open Data. We are always open to host volunteers or job students at KBR!
Geospatial research
One particular type of DH data is geospatial data, think of digitized old maps or location information in metadata. This again is something where DH shines, beautiful old maps are digitized and used.
There was a keynote about geo metadata and large language models, and talks around historical location data in Belgium and in Greece as well as location data in written works.
Closing keynote about Geographic Information Systems
The closing keynote from Piraye Hacıgüzeller provided thoughts on typological thinking and traditional Geographic Information System (GIS). It mainly focused on the complexity of encoding geographic information on archaeological sites.
They tried to encode this kind of information using CIDOC-CRM, but it was not expressive enough. Furthermore, some geographical information is difficult to express on maps, but more easily in text due too ambiguity and fuzziness such as for directions.
Piraye highlighted that with ArcheoBERTje, a sophisticated language model in Dutch language exists (based on the Dutch language BERT model BERTje). According to research, this language model could not further be improved with domain-specific thesauri as it already covered all the relevant information.
She ended the talk with the open question if there is still a need for metadata. Unfortunately there was not much time for the QA. But after the conference I checked again the presentation with the title The future of Knowledge Graphs in the World of Language Models by one of Wikidata’s founders Denny Vrandečić. And I think there are a few good points why there still is a need for curated metadata. As Denny phrased it:
“In a world of infinite content, knowledge becomes valuable.” - Denny Vrandečić
However, I get her point, especially after the explanation of the issue with fuzziness in geographic data in text. Thus who knows, for certain applications and use cases a language model might still be helpful and even preferable to metadata following a (too) strict schema.
Historical Belgian places
Léa Hermenault presented the Belgian Historical Gazetteer (DOI: 10.5281/zenodo.7997173. Their work will create a database of historical place names that will facilitate the mapping of place names found in historical documents.
They are using a PostgreSQL database with PostGIS extension to store the data. Furthermore, they are using the tool OpenRefine to enrich the data and create RDF. Eventually the data will reside in a Druid database hosted by Triply.
This is a great project which also facilitates (upcoming) work at KBR. In the recently approved project MetaBelgica, KBR and three other Federal Scientific Institutes will combine their person, organization, events/time and location information into a Wikibase instance. The presented historical gazetteer is a great reference dataset.
Vincent Ducatteeuw presented another project that focuses on historical Belgian geo data (DOI: 10.5281/zenodo.7945196), more precisely on historical street names in the city of Ghent. Street names change over time and there is an ontological issue: if a street name has changed, is it still the same street or a new one?
In his presentation, Vincent explained that they are using an identification methodology to distinguish streets by their proper name and their location or type of mereology (DOI: 10.3233/AO-200235). Furthermore, they are applying this methodology on the Wegwijzer der stad Gent, a city directory with scanned documents from 1875-1932.
Historical Greek places
Laura Soffiantini is pursuing the research question How Greece is described in Natural History? How, why, and in relation to what does Pliny refer to Greek places?
Therefore, she is using a multi-step workflow to extract place names from TOPOSText, enriches is with the tool flair and disambiguates places with the help of an authoritative list from Trismegistos and the tool TheFuzz (formerly known as FuzzyWuzzy).
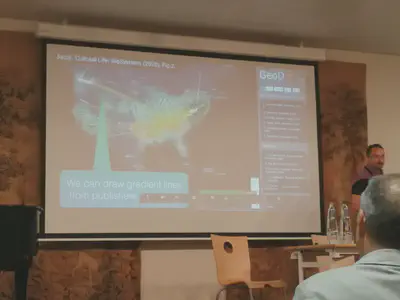
Visualizing location data in books
Dan Costa Baciu presented a prototype to visualize location data of well-known institutions, infrastructures, etc that are found in books.
He argues that geospatial discovery such as in GoogleFlights or AirBnB does not yet exist for library catalogs. But also that it would be useful! However with their platform it is possible. They are using different color to distinguish between location data of the book metadata (such as publisher location) and location data extracted from the content of the book.
This is a very interesting and cool idea. For the BELTRANS project I am working on, which covers FR-NL / NL-FR translations, this would be a really interesting way to visualize data. Especially, since for certain comics, locations in the book are culturally translated as well. For example, Belgian cities of the Wallonian region in Belgium that got translated to Dutch cities for the translation for the Dutch-language market (translations that mainly target the larger Netherlands rather than Flanders).
However, this would require extracting the location information of the books. Hence this is a bit out of scope of the quantitative study in BELTRANS. But it would be an interesting addition to refine the BELTRANS corpus in the future (see also my notes on collection-centric thinking here in this blog post).
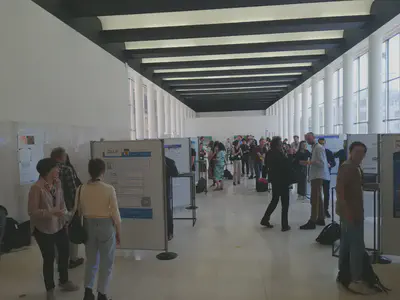
Poster session
There was of course also a poster session with many interesting posters.
One poster (DOI: 10.5281/zenodo.7976748) was about the research in the BELTRANS project for which I also work. It was presented by two of the project’s PhDs students: Clara Folie and Timothy Sirjacobs.
Another interesting poster (DOI: 10.5281/zenodo.7986819) was about the organization of a Hackathon at KU Leuven, presented by Leah Budke.
My ex BESOCIAL colleague Fien Messens presented a poster (DOI: 10.5281/zenodo.7956417) on web archiving of religious websites at KU Leuven.
Final remarks
This is it, I hope you enjoyed reading this rather lengthy blog post about DHBenelux 2023.
Thanks to my colleague Julie Birkholz and all the other organizers and volunteers for making this DHBenelux edition happen! The presentations gave me a lot of food-for-thought and I enjoyed catching up with the community. See you at the next year’s edition at KU Leuven.
Don’t forget to share this post on social media and in your networks!
Please also consider subscribing to my bi-weekly Newsletter FAIR Data Digest to receive more interesting content every other Tuesday!