ISWS 2018 Poster
For the ISWS summer school I prepared an interactive poster. Read in his post what it is about and see how it was made.
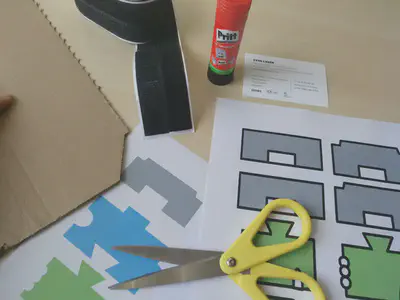
My summer this year will start with the attendance of the International Semantic Web Research Summer School (ISWS) in Bertinoro, Italy. For that we were invited to bring a poster, describing our PhD research. My current research tasks involve so called shapes, describing data within a graph of information. Since graphs and shapes are very tangible concepts, and one of the main goals of the poster is to gather feedback, we had the idea of making the poster a bit interactive. My supervisor suggested post-its, but as I have a lot of creative energy (and probably procrastinate writing papers), I decided to go for a small Knowledge Jigsaw Puzzle.
What is the whole context?
Within the Semantic Web, information are modeled using vocabularies of terms, relationships among these terms and also constraints, things which aren’t allowed. The combination of the mentioned vocabularies, relationships and constraints is usually called an ontology and can be expressed in a formal language. That formalization allows computer programs then to “understand” the data, but also to infer new knowledge. For example, if I model persons and say that there is a relationship called “knows” which means that both people know each other, and I have the Information that Sven knows you, then the information that you know Sven can be inferred.
What has this now to do with shapes?
Well, constraints modeled in an ontology are used to infer new knowledge, they are not meant to use for validating data, e.g. that a person must have at least one last name. There are various reasons for that, which are out of scope for this blog post. Important is now, that recently the W3C committee released a standard to express constraints as shapes on data used i.a. for validation. It’s all quite new, so there are no clear methodologies yet, when to use shapes of data, when to use constraints in the ontology or when to use a formal rule language (yes these exist as well).
Okay okay, enough background, what’s the interactive poster now?
I am currently working on a project, which is about improving the customer journey when using public online services. An example: You want to move, so you have to do certain tasks at the city you are currently living in, like e.g. sign-off and provide your new address. At the city you are moving to, you have to provide certain information as well, e.g. if you’d like to request a parking spot for your car. These are all steps you should do, and they can be understood as a workflow. The aim of the project is to build customized user interfaces across cities. So that it seems you are only interacting with one system, whereas in the background multiple forms of different websites are filled in.
The customization here is the key point! Beside simple optimization like asking you only once for your old address (or even reuse it if the government has that information already), we can think of more personalization.
That’s were shapes come in. Given one or multiple workflows, containing different steps, your preferences can be modeled as shape(s) and be used to select the optimal steps for you. Similarly, context information like the device you are using or a certain life situation you are currently in, are somewhat constrains which can be used for optimal steps selection.
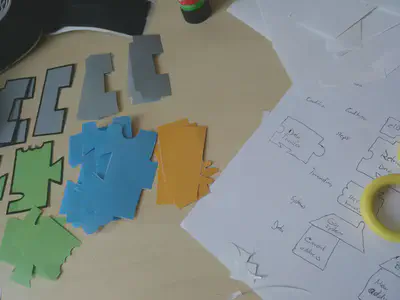
What I did now for the poster is to model the steps to do (blue), conditions need to be met for that step (grey) a transaction (green) with a certain system (orange). In the simple puzzle setup there are shapes for secure transactions (https) and conditions.
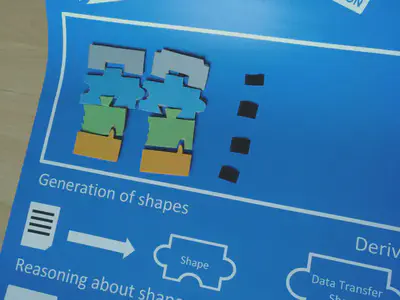
That is of course only a toy example of one possible way of modeling such steps.
Research-wise it is interesting to investigate in the use of shapes, finding out when they are useful and when it is better to use other means of representing constraints. If shapes are used it is also interesting to investigate if shapes shall be only applied one after each other or if they can be combined somehow. Can we derive new shapes? Also Reasoning becomes interesting, given different context constraints and other user constraints, can we infer new shapes?
A lot of research to be done! I am looking forward to get a lot of interesting feedback in the poster session.