It is particularly challenging to explain PhD research to family and friends, especially in an abstract field such as Computer Science. In the following blog post I will try to explain my PhD, freed from academic precision and more from the big picture and with plenty of examples.
The bullet points form one coherent story, but each paragraph marked with an arrow can be clicked to read more details.
The context
Did you ever wonder how an assistance system like Alexa or Siri can answer arbitrarily questions? Therefore such a system needs to search data of different disciplines also referred to as domains.
To assist that, it makes sense to combine these data in a natural way, you have to imagine it like a graph: nodes are things like concrete persons and connections between the nodes are the relationships between those things. As text such a graph could look like this:
Sven hasBirthday 25.04.1988 .
Sven worksFor IDLab .
IDLab headQuartersIn Belgium .
Belgium belongsTo Europe .
But first it has to be determined **what** can be connected **how** under which **restrictions** and this is called a **data model**. In this example my employer IDLab, which is an organization cannot have a date of birth and similarly Sven cannot have headquarter as he is a person. Generally speaking I'm researching how such data models can be created.
Data modeling is nothing new, but in contrast to the past where data was modeled for a single database or a single computer program we make use of the world wide web. Each concept and every relationship such as `person` and `headQuartersIn` but also concrete data itself like `Sven` or `Belgium` gets an own web address! Thereby they are globally unique identifiable and computer programs as well as users can look up the concept or the information! This could look like on the following page: https://sven-lieber.org/profileMy research - part 1: the data modeling process
Well, everyone can create such a data model in one afternoon, this is not a big deal. The challenge, however, is to make it professional so in the end a qualitatively high data model pops out. Ideally the data model should be constructed in a way that it solves the problems it was created for in the first place! For the question “How is the weather today in Ghent?” the data model for example at least needs to represent the concepts weather and town as well as temporal information.
Now a data model can be developed being easy and reusable, or complex and tailored to solve a very concrete problem.
An example of an easy and reusable data model: if you google any business, Google will show you on the right within an infobox what the opening hours or the founding year of that business is. Among others, Google can do this because the website owners used a standardized data model to mark information in their website. Not much precision is needed as the information is mainly shown to humans. In contrast to this, in *biomedical* science very complex data models following logical rules are created which are very precise such that also computer programs can "understand it".Usually within the creation of a data model one has to talk to officials and experts, analyze existing data and have a clue about existing data models. After all the data model should follow standards and support seamless data exchange with other data models, called interoperability. **All that is also a complex process which can be split into steps.**
By the way, this is the same for professional software engineering. A measurable process subject to optimization distinguishes software engineering from the simple act of *programming*.The first part of my research revolves around this process.
I’m pursuing the question what is the best way to represent restrictions in a data model,
so how one can create a data model which is not too simple but also not too complex for a given problem.
Restrictions could be on the one hand logical axioms like all life forms have a birth date,
or on the other hand testable constraints important for data exchange and data quality such as the birth date has to be smaller than the death date.
Thereby I do not reinvent the wheel, I carefully read the literature of knowledge modeling and I still do! The goal is to reuse existing methods as much as possible but to adapt them to the modeling of constraints. Part of this is also to analyze which measurable pros and cons arise if certain restrictions are either expressed as logical axioms in the data model or as constraints. One use case in my PhD are privacy regulations. To check compliance with privacy regulations on the one hand the data model needs to provide relevant information and on the other hand constraints are possibly needed.
My research - part 2: user-friendly visualizations
In my lab we mostly work in different projects together with industry, the government or institutions. The experience of these projects revealed concrete problems regarding user-friendliness of modeling languages: A 2017 newly introduced language to represent constraints in graph data models is text-based, user have to first learn it which might be tricky!
Pictures are worth a thousand words. Humans possess an astonishing information processing system though, .. no, I do not talk about the smartphone in the pocket but about the brain! From cognitive science we know that text is processed slowly as we have to concentrate more. In contrast to that shapes and colors are almost automatically processes with no visible effort. We work with knowledge graphs which are tangible, we take advantage of that!
We develop graphical languages to describe constraints on our knowledge graphs. Based on the assumption that such languages are more intuitive compared to an alien text syntax we examine in user studies which graphical languages are suited best.
And why all that?
Data without description is useless. Imagine you find a piece of paper full with numbers. Without context you have no clue what these numbers mean. Maybe somewhere a computer program exists which knows how to read and interpret this data. However, for you or other programs this piece of paper is useless!
Adding descriptions provides context and makes the data self-describing and hence interpretable. If you note on the piece of paper that the first column is weight measured in kilogram and that the second column represents birth dates and that both are characteristics of a person whose name is noted in the third column you performed data modeling! Additionally the data are now self-described and independent from specific computer programs. By the way: This piece of paper could be representative for a file or a website.
If data are properly described they can be combined in a meaningful way and such combined data can be searched quicker, easier and most importantly in a uniform way which is then utilized by systems such as Alexa or Siri! A not-meaningful combination is for example the addition of a temperature in degree celsius on my age in years.
Summarized
Based on what was read we can summarize: I deal with data modeling. I pursue the question how we can build knowledge graphs which also comply with requirements towards data quality and privacy. In particular I investigate on the one hand methods of knowledge engineering, so which steps need to be performed to create such knowledge graphs, and on the other hand the user-friendly visualization of data constraints such that also non-experts can create such constraints.
So that’s it! I hope I cleared some things out :-)
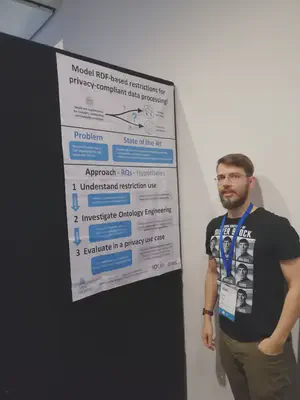
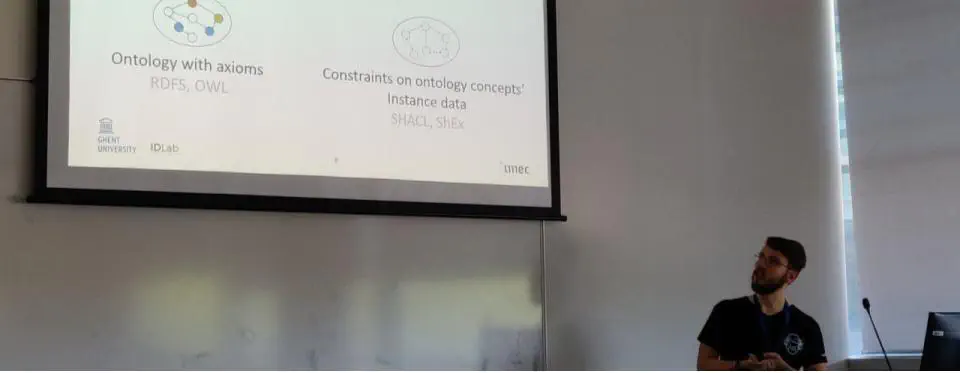
Below is a picture of the ISWC 2019 conference where I presented my PhD plan both as presentation and as a poster (my trip report of this conference held in New Zealand is here).